Drought Monitor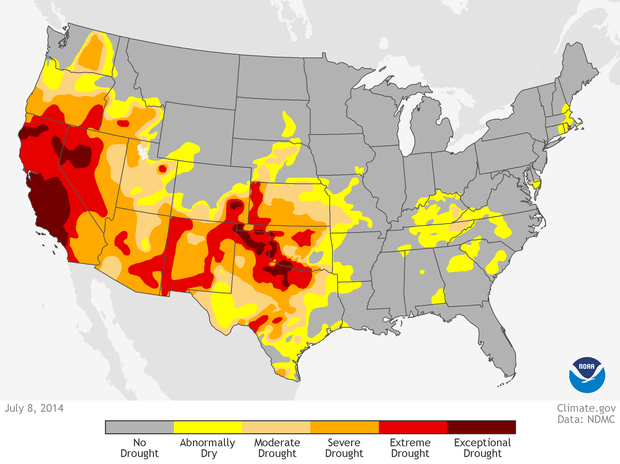 During July 2015, California was still in the state of a severe drought. We felt the effects drastically in Turlock especially. It was a difficult few years as rainfall was scarce and conservation of water became a major issue. Sea Surface Temperature (SST)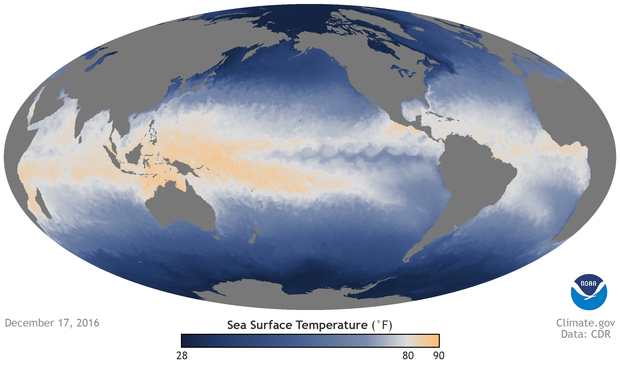 Data from 2016 shows how the surface temperature of the oceans is beginning to heat up. This may be happening as a result of carbon emissions, climate change, and/or global warming. Monthly Precipitation Outlook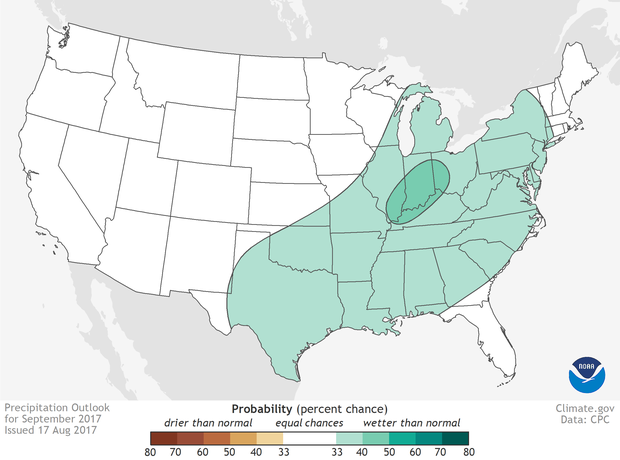 August 17 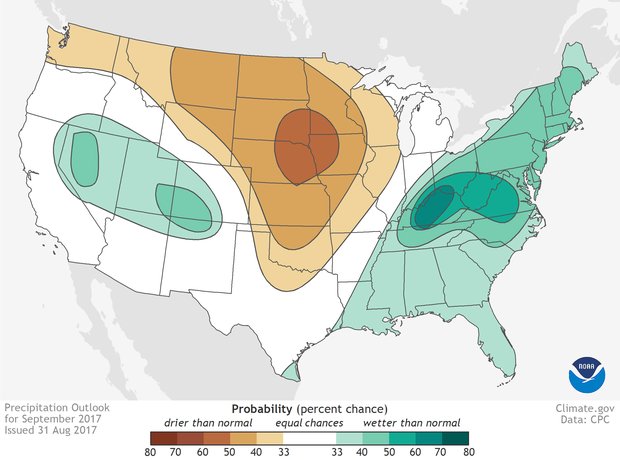 August 31 Within a few days, the precipitation outlook changed drastically with data ranging from the bottom to the top of the spectrum. This may be due to hurricanes on the east and southwest coasts, and wildfires in the west. Total Monthly Precipitation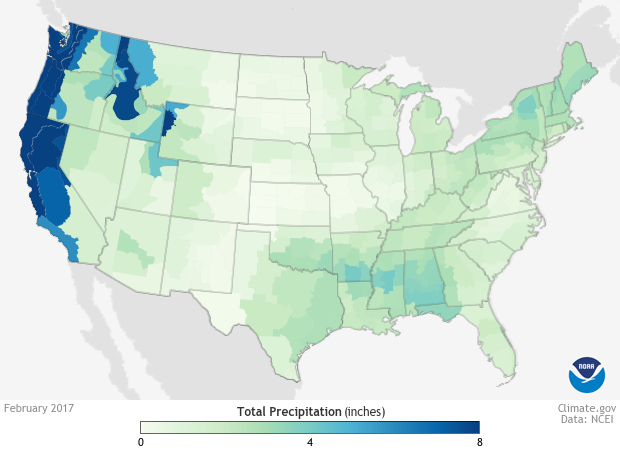 In February 2017, the west received more rainfall than the east. I find this unusual because at this time the east coast is still typically covered in snow, or water at least. Average Monthly Temperature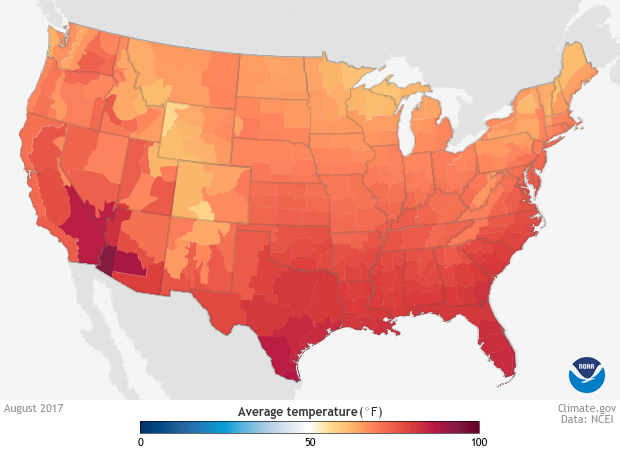 This graph shows the average monthly temperature in August 2017. Because that was still in the middle of summer, it is predicted that most states were still on the warmer end of the spectrum. However I found it interesting that in states such as Colorado and Wyoming, some average temperatures are more in the 60s or 70s.
0 Comments
Leave a Reply. |
AuthorWrite something about yourself. No need to be fancy, just an overview. Archives
October 2017
Categories |
 RSS Feed
